Why your days go well — and why they don't.
Patterns across routines, transitions, and mood — not just how the day felt.
Some days go better than others. You just don't know why.
Mood apps flatten a day into an emoji. Journals take twenty minutes. Dashboards show numbers without context. DaySteps captures the high and the low of each day, plus what actually happened — which routines held, which steps stalled, where the friction lives. What memory forgets, the system keeps.
See what's working. Adjust what isn't.
Patterns emerge from the routines your family already runs — no extra logging, no daily check-ins. The data builds quietly, so when you need to adjust, you're not guessing.
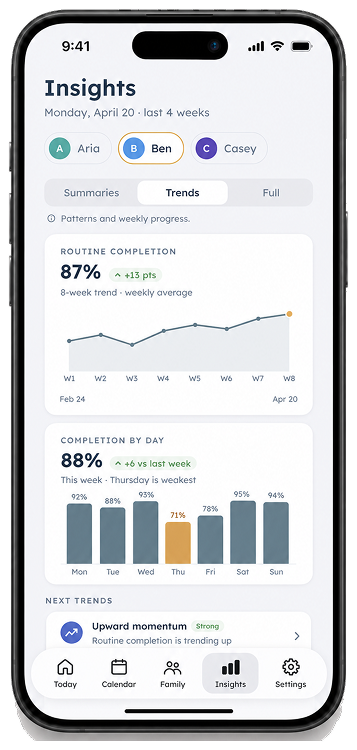
Routine completion over time
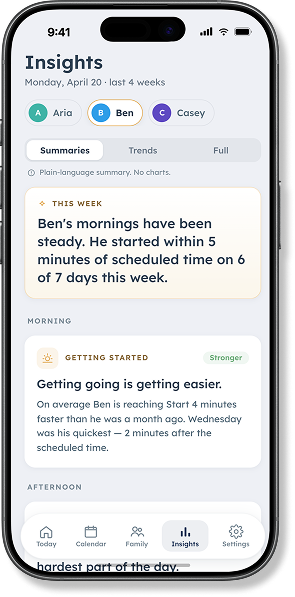
Which routines hold. Which break down.
Initiation timing
Planned vs. actually started — where the delay really lives.
Step-level friction
Which specific step consistently stalls.
Mood as context
The high and the low — one signal among several, never the whole story.
Mood is one signal. Behavior is the system.
LEARN ABOUT THE SCIENCE BEHIND IT →
What's included and what we left out. On purpose.
Everything this includes
- Best-and-hardest daily capture.
- Step-level friction view.
- Routine completion trends.
- Adult-only — never shown to the child.
What we said no to
- No emoji picker — a smiley face isn´t data.
- No streaks, no daily score, no red days.
- No comparison across children, clients, or students.
- No data sold or used outside your account.
Works alongside...
Check out the rest of the system
Stop being the system. Start using one.
Ready when you are
You're on the list — we'll be in touch.